
View Our Range


We recently wrote an article on how to read the information presented on a standard centrifugal pump performance curve and to develop this further we need to examine how this relates to the system curve. So, what is the system curve? This plots the head in terms of the static head (that does not change) in addition to the pressure loss through the system that will increase as the flow rate increases. This is a key element of the system curve as friction loss through pipework, elbows, valves, etc.
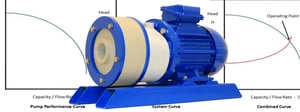
Performance Curve

Here is a simplified pump performance curve Showing (as usual) head on the vertical axis and flow on the horizontal axis.
System Curve

And now a System curve, the system line will start at the static Head point at zero flow and gradually rise as friction head increases with flow. The static head is the actual height the liquid needs to be lifted, as the flow increase there will be more friction loss through the pipework and fittings so that the overall head rises.
Combined Curve

Finally, if we combine the two curves, we can see the intersecting point between the curves which will be the operating point. If the two curves do not intersect then the pump is not suitable for your application.
A point to note
All centrifugal pumps will have a best efficiency point (BEP) that is usually marked on the performance curve, it is important to select a pump that is as close to the BEP as possible, usually within 20% below and 10% above. Running a pump close to the BEP will ensure a longer and trouble-free life as well as lower operating costs. A pump can have its impeller trimmed to bring it closer to the BEP if required.
We often post articles and other news on our LinkedIn page so please go and follow to keep up to date or for any pump queries you may have please contact us.